Introduction
Graphs are often very useful for displaying information based on figures. Who hasn’t embedded a diagram in an Excel sheet or PowerPoint presentation? But that is far from reaching the limits of modern computer graphics and programming techniques. Nowadays there is an extensive catalogue of libraries that provides 3D animations, zooming, perspectives and many other utilities that are used when programming video games. This article will describe how one of these also can be deployed in business software, in order to include powerful and sleek graphics. It will also be accompanied with a simple but instructive Open Source programming example that generates a 3D graph, as shown in this video:
The ScalaFx API
Scala is a versatile language with both functional and object-oriented capacities. It is closely related to Java and can make use of all the existing utilities in the Java universe. One good example of this is the ScalaFX wrapper for the JavaFX library. It gives access to an immense toolbox for computer graphics, aimed at building desktop applications but also extensible to web and mobile ones. Besides the menus, buttons, text fields, multimedia and any other component of a window GUI there are also a collection of 2D graphs, all of which can be styled with CSS. That is, the very same standard that is commonly used for web design.
ScalaFX / JavaFX can also be used for the graphical design of modern video games and other applications that require visualization and animations in 3D. There is a large collection of utilities for creating shapes, transitions, perspectives, movements and other necessary artifacts. Its usage requires some technical knowledge but – as always in the Open Source world – there is a lot of information and tutorials to be found on Internet. In fact, it is not too difficult for a beginner to start building for example 3D charts, as will be described in the next section.
How to Build a 3D Graph
The first thing to know is that almost every ScalaFX application builds upon some basic concepts:
- Every application has at least one Stage, which represents a GUI window, and a Scene which is a container for the graphical elements.
- A hierarchy of Nodes or Controls can be added in the window. They can be for example layout components, such as panes and grids, or interface components such as buttons, textboxes, menus and sliders.
- Interaction with the user via is handled as Events, which can be for example mouse clicks or keyboard actions.
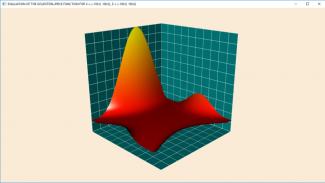
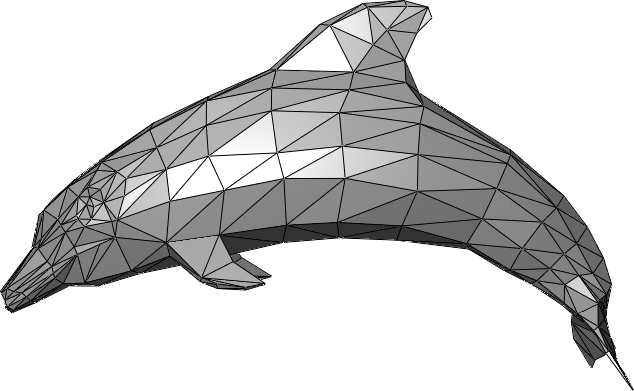
The graph shown in the beginning of this article consists of two objects. Firstly, there is an open cube that represents the x, y and z axes or planes. Secondly, there is a surface that has been constructed my mapping x and z values to a function y = f(x, z). To build the surface, one can use a Triangle Mesh, which defines a 3D shape as triangles. Here’s an example from Wikipedia:
On a technical level, it can be a little cumbersome to define the mesh, since each triangle has to be assigned spatial coordinates for corners, sides and texture. Anyway, it can of course be done programmatically in Scala and once it is there, it will work forever. The result is a very realistic diagram that with just a little extra programming can be rotated 360º and zoomed-in-and-out by the user!
An unlimited world of applications
As somebody once said, a picture can be worth a thousand words. We often prefer to bring catchy diagrams instead of dreary figures to meetings, conferences and other business gatherings. It often makes sense, since images can be faster to process and easier to remember for the human mind. It is also common to find graph display capacity in financial software platforms for trading, risk management and other activities.
Three-dimensional graphs are less common but there are many fields where they can be very useful. Just to mention a few examples closely related to the world of economics and finance
- Multivariate statistical distributions
- Volatility surfaces for financial instruments
- Interest rate curve evolution over time
- Macroeconomic saddle point stability
In all these cases, static two-dimensional diagram can be much less illustrative than their animated 3D cousins. The bottom line is that with APIs such as ScalaFX at hand, it has become much easier to include 3D in economics and financial software when needed… and thus taking a first small step towards augmented reality.
More information
A code example based on this article is available at GitHub
- Inicie sesión para enviar comentarios