A quick guide on how to make your own software application that handles official statistics, accompanied by a Scala programming example.
Introduction
The information society is not only about sipping from a data lake provided by online newspapers, social networks and other Internet sources. Nowadays we also can access to an ocean of official and other data all by ourselves. All it takes is some basic programming skills and of course to know what to look for and where
This article will discuss three techniques that can be used for easy access to data, to extract the relevant information and to visualize it to gain knowledge. The article will not contain any code but a link to a complete Scala programming example is provided at the end of the article.
Hands-on Access to Eurostat data with REST
Representation State Transfer (REST) is nothing new – it is employed every time we navigate to an Internet page via the HTTP protocol. But it is not exclusive to that, it can also be seen a as one of the general methods for data exchange over network connections.
To make a REST request for Eurostat data, we just have to build a specific URL that tells Eurostat what we wish to download. Their specification is shown in the picture below (Source: Eurostat):
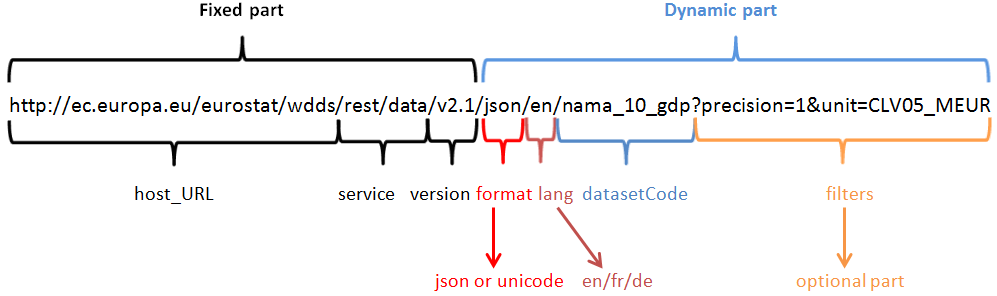
As you can see, the URL contains a fixed part and also a variable part where we can specify for example which data set we are looking for and eve apply some filters of convenience. You might try the following example to retrieve the annual average EUR-USD exchange rate for the last ten years:
From JSON-stat to something more useful in an app
The data request above will return a JavaScript Object Notation string of characters that can be interpreted in a web browser or downloaded to a file. JSON is a popular format for data exchange over Internet and might be easier to handle than XML. Here goes a basic example of a Json file:
{
  “Person”: {
    {
      “name”: “Jane”,
      “age”: 25
    }
  }
  “Person”: {
    {
      “name”: “Tarzan”,
      “age”: 26
    }
  }
}
Eurostat uses a more complex variant called JSON-stat, where the information is represented as data cubes, i.e. multidimensional arrays. Anyway, we need to read and transform – parse – the data into something that can be used in a computer program. There are several ways of doing it; one is to use a library called Jackson, to convert our Json string into Java objects.
Visualization made easy with ScalaFX graphs
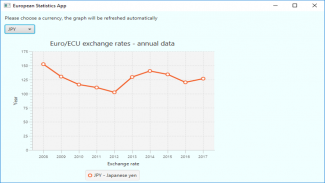
After downloading and parsing the Eurostat data, you might also want to display it in a diagram. This can be done rather easily with the ScalaFx library, which in its turn is based on JavaFx. Both these are increasingly popular libraries that eventually will replace Swing as industry standard for window GUIs in Scala and Java applications, respectively.
The whole procedure of downloading data to an intermediary file, reading the file, parsing the data and finally displaying it in a graph can be remarkably simple and fast. We decided to develop a test example - which ended up as just a little more than 200 lines of code – where the user can switch currency to see different exchange rates. Once our Scala application is up and running, it connects to Eurostat, downloads, writes, reads, parses and display data for a new currency in a mere fraction of a second.
More information
A code example based on this article is available on GitHub.
Other useful links:
ScalaFX - Ensemble graph examples
- Log in to post comments